 Log in to the Airly Data Platform
 Airly Map
From numbers to insights:
Make sense of the data
Raw data alone doesn’t solve air quality challenges, insights do. Airly Data Platform ecosystem transforms billions of data points into actionable understanding. From interactive dashboards to auto-generated reports, we empower local authorities, enterprises and communities to interpret trends, report on impact, and uncover the ‘why’ behind the numbers.
Key analysis & insights tools
Airly
Data Platform
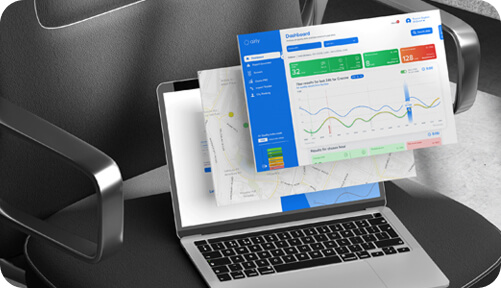
Real-time monitoring, reports generator, trends and alerts, all in one place. Gain instant insight across your locations and turn air quality data into action.
See full product page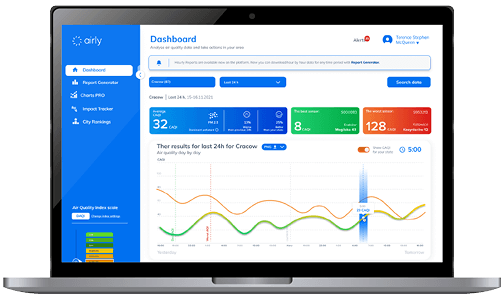
Bespoke Air Quality Reports
Data Science team at Airly can provide customised air quality reports for your organisation using data from our sensors, reference analysers as well as 3rd party data.
See full product page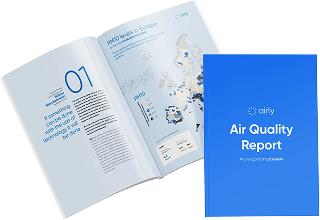
API
Airly API delivers the best air quality data trusted by 3,000+ organisations and powering over 7 million data calls daily. Designed for seamless integration, it offers real-time data from 13000+ data points and reference sources like EEA, DEFRA and GIOŚ.
See full product page
How to turn air quality data into actionable impact
How to monitor, analyse and act with Airly Data Platform
Watch how Airly’s dashboard helps you track air quality, set alerts, generate reports and turn data into action across multiple locations.
How to communicate air quality clearly with Factsheets
See how auto-generated, branded PDFs turn complex data into easy-to-share summaries for residents, employees or decision-makers.
We have answers to your questions
Haven't found the answer to your question?
Our team will be happy to answer your questions
Contact Us